Database Metrics
FlashORM Studio includes a built-in Metrics dashboard that gives you real-time visibility into your database's health, performance, and activity — without any external monitoring tools.
Accessing Metrics
Click the chart icon in the left navbar of FlashORM Studio, or navigate directly to /metrics.
flash studio
# then open http://localhost:PORT/metrics
Database Support
| Metric | PostgreSQL | MySQL | SQLite |
|---|---|---|---|
| Connections | ✅ | ✅ | ✅ (always 1) |
| Database Size | ✅ | ✅ | ✅ |
| Cache Hit Rate | ✅ | ✅ | ❌ |
| Deadlocks | ✅ | ❌ | ❌ |
| Row Activity | ✅ | ✅ | ❌ |
| Active Queries | ✅ | ✅ | ❌ |
| Query Performance | ✅ requires pg_stat_statements | ✅ requires performance_schema | ❌ |
| Table Sizes | ✅ | ✅ | ✅ |
Cloud databases (Neon, PlanetScale, etc.)
FlashORM automatically falls back to available system views when certain tables are restricted. On Neon for example, pg_statio_user_tables is used instead of pg_stat_database.
Metrics Tab
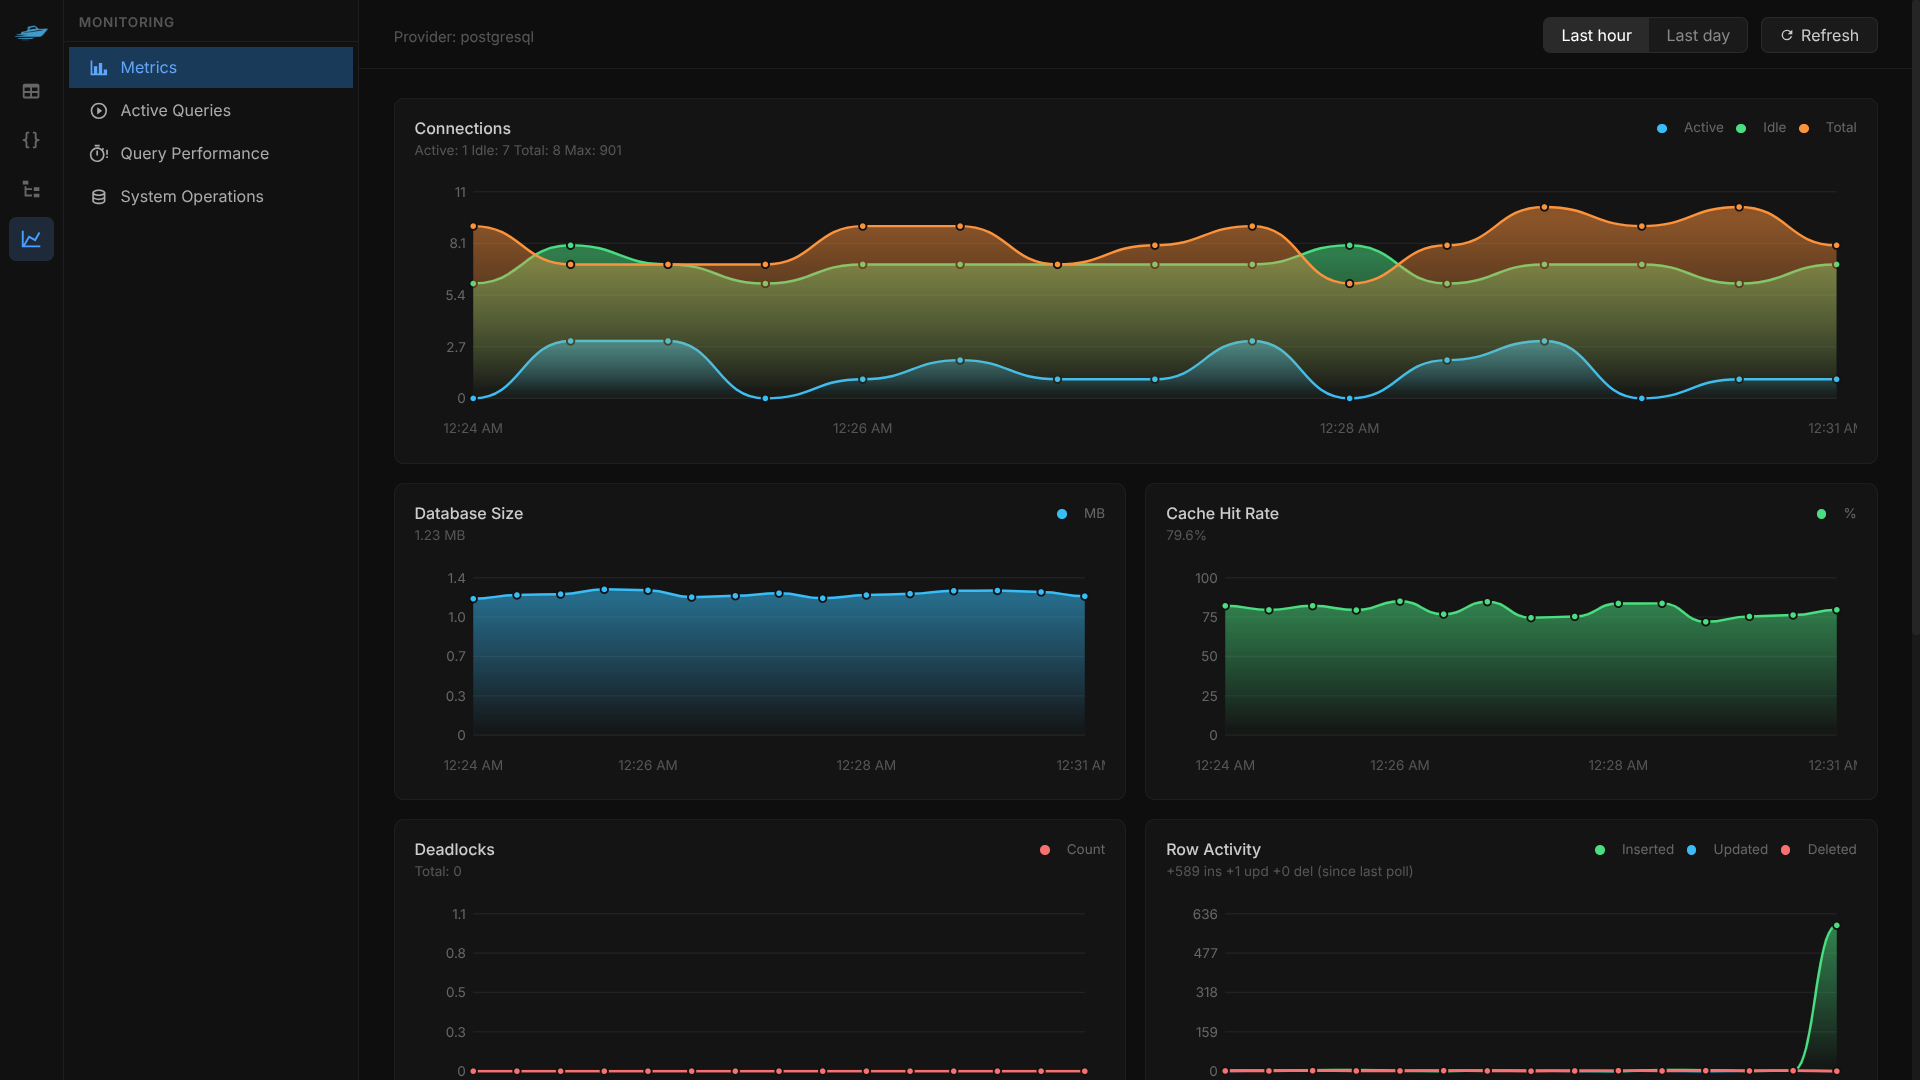
The main dashboard shows time-series area charts that auto-refresh every 30 seconds. On first load, charts are seeded with slight variation around the current values so lines are immediately visible.
Connections
Tracks how many database connections are open:
- Active — connections currently executing a query
- Idle — connections open but waiting
- Total — all open connections
- Max — configured connection limit (
max_connections)
High active connections close to max means your connection pool may be saturated.
Database Size
Total disk space used by all tables and indexes, shown in B / KB / MB / GB.
Cache Hit Rate
Percentage of data reads served from memory vs. disk:
- > 90% — healthy
- < 80% — consider increasing
shared_buffers(PostgreSQL) orinnodb_buffer_pool_size(MySQL)
Deadlocks
Count of deadlock events since the last stats reset.
A deadlock happens when two transactions are each waiting for a lock the other holds. PostgreSQL auto-detects and resolves them by cancelling one transaction.
Transaction A: locks row 1, waiting for row 2
Transaction B: locks row 2, waiting for row 1
→ Deadlock — PostgreSQL cancels one transaction
A non-zero deadlock count in production usually indicates a concurrency bug — transactions updating the same rows in inconsistent order.
Row Activity
Shows inserts, updates, and deletes per poll interval (delta, not cumulative totals), so you can see write activity spikes in real time.
- Spike in inserts → bulk import or high write traffic
- Spike in deletes → cleanup job or bulk removal
- High updates → frequent record modifications
Active Queries
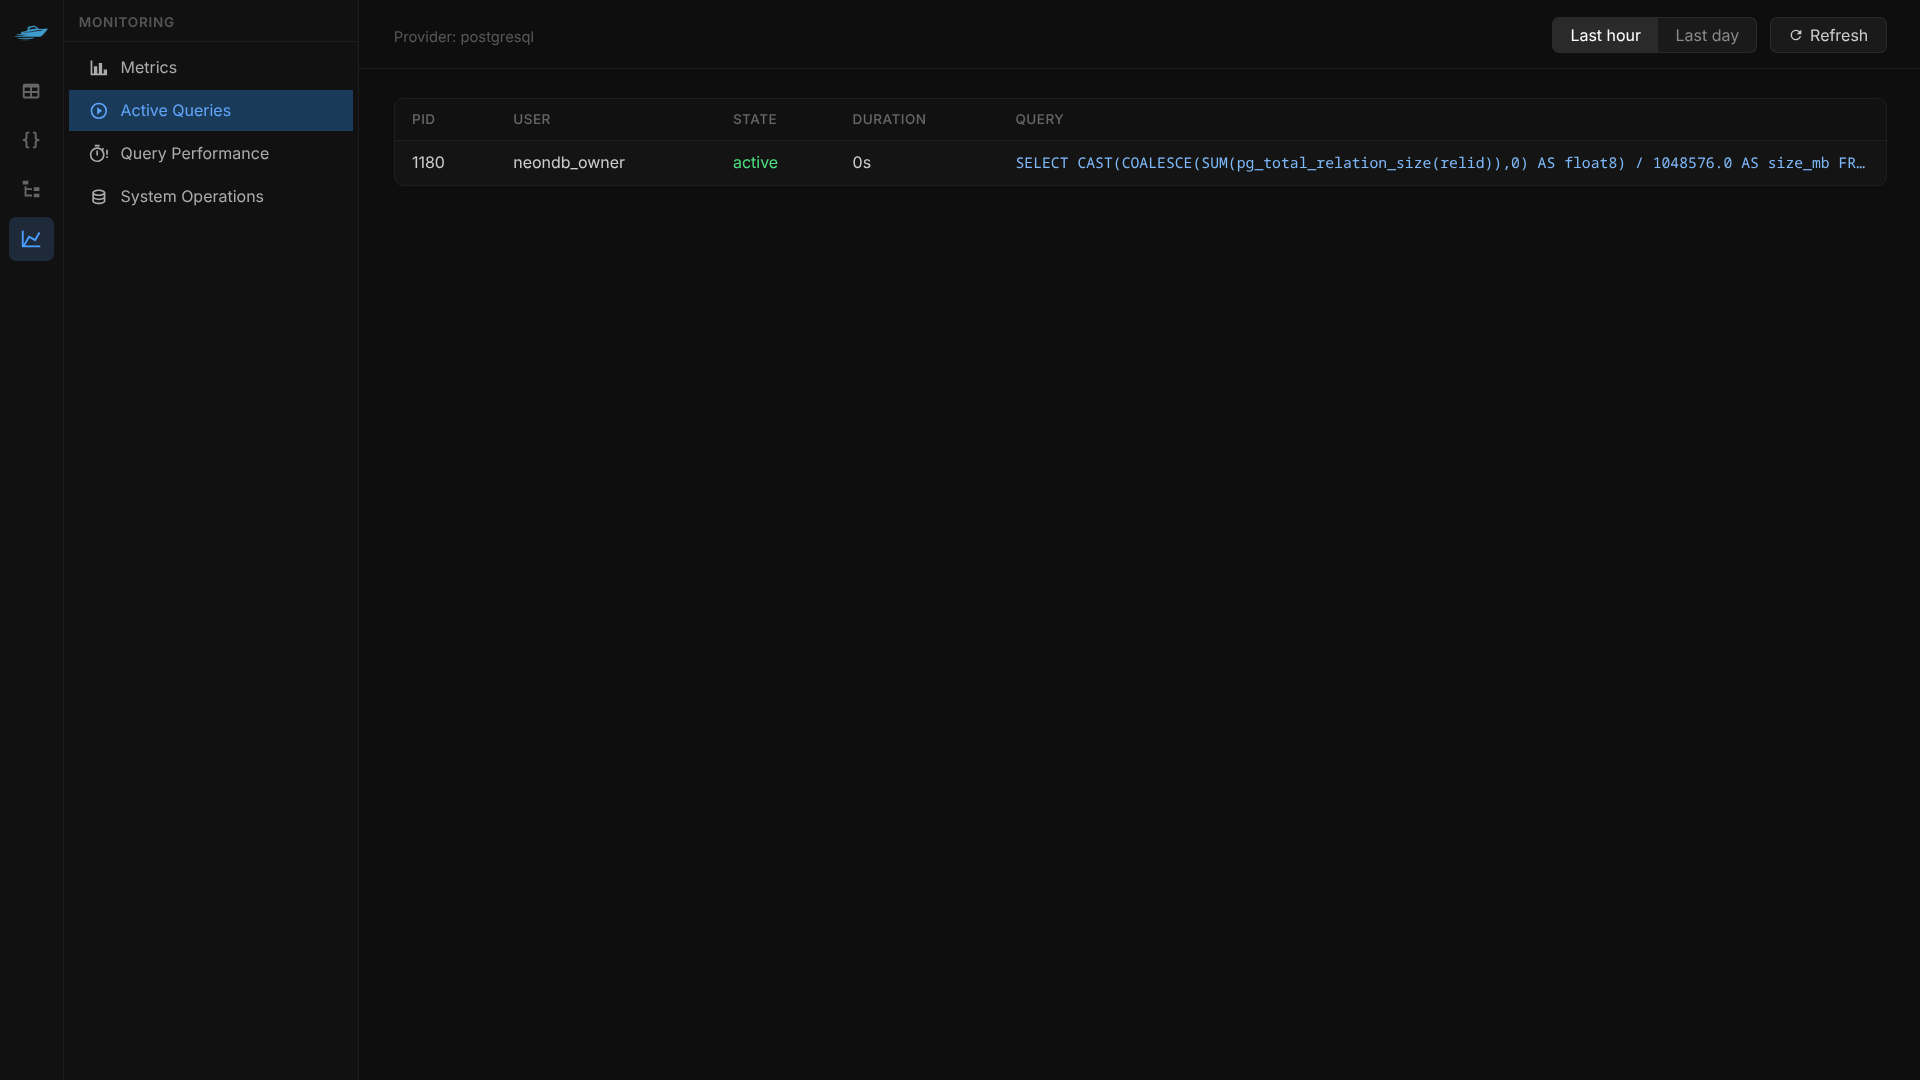
Shows all queries currently executing on the database:
| Column | Description |
|---|---|
| PID | Process ID — use to kill a stuck query |
| User | Database user running the query |
| State | active = running, idle in transaction = waiting |
| Duration | How long it has been running |
| Query | SQL being executed (truncated to 120 chars) |
Long-running queries
On PostgreSQL, kill a stuck query with:
SELECT pg_terminate_backend(PID);Query Performance
Shows the top 10 slowest queries ranked by mean execution time.
Requirements:
- PostgreSQL:
pg_stat_statementsextension - MySQL:
performance_schema(enabled by default on MySQL 8+)
Enabling pg_stat_statements on self-hosted / Docker:
docker run ... postgres -c shared_preload_libraries=pg_stat_statementsThen run once in your database:
CREATE EXTENSION IF NOT EXISTS pg_stat_statements;Reading the table:
| Column | Meaning |
|---|---|
| Query | Normalized SQL ($1, $2 replace actual values) |
| Calls | How many times this query ran |
| Mean (ms) | Average execution time — sort by this to find bottlenecks |
| Total (ms) | Total cumulative time |
| Rows | Average rows returned/affected |
A query with high calls + high mean ms is your top optimization target.
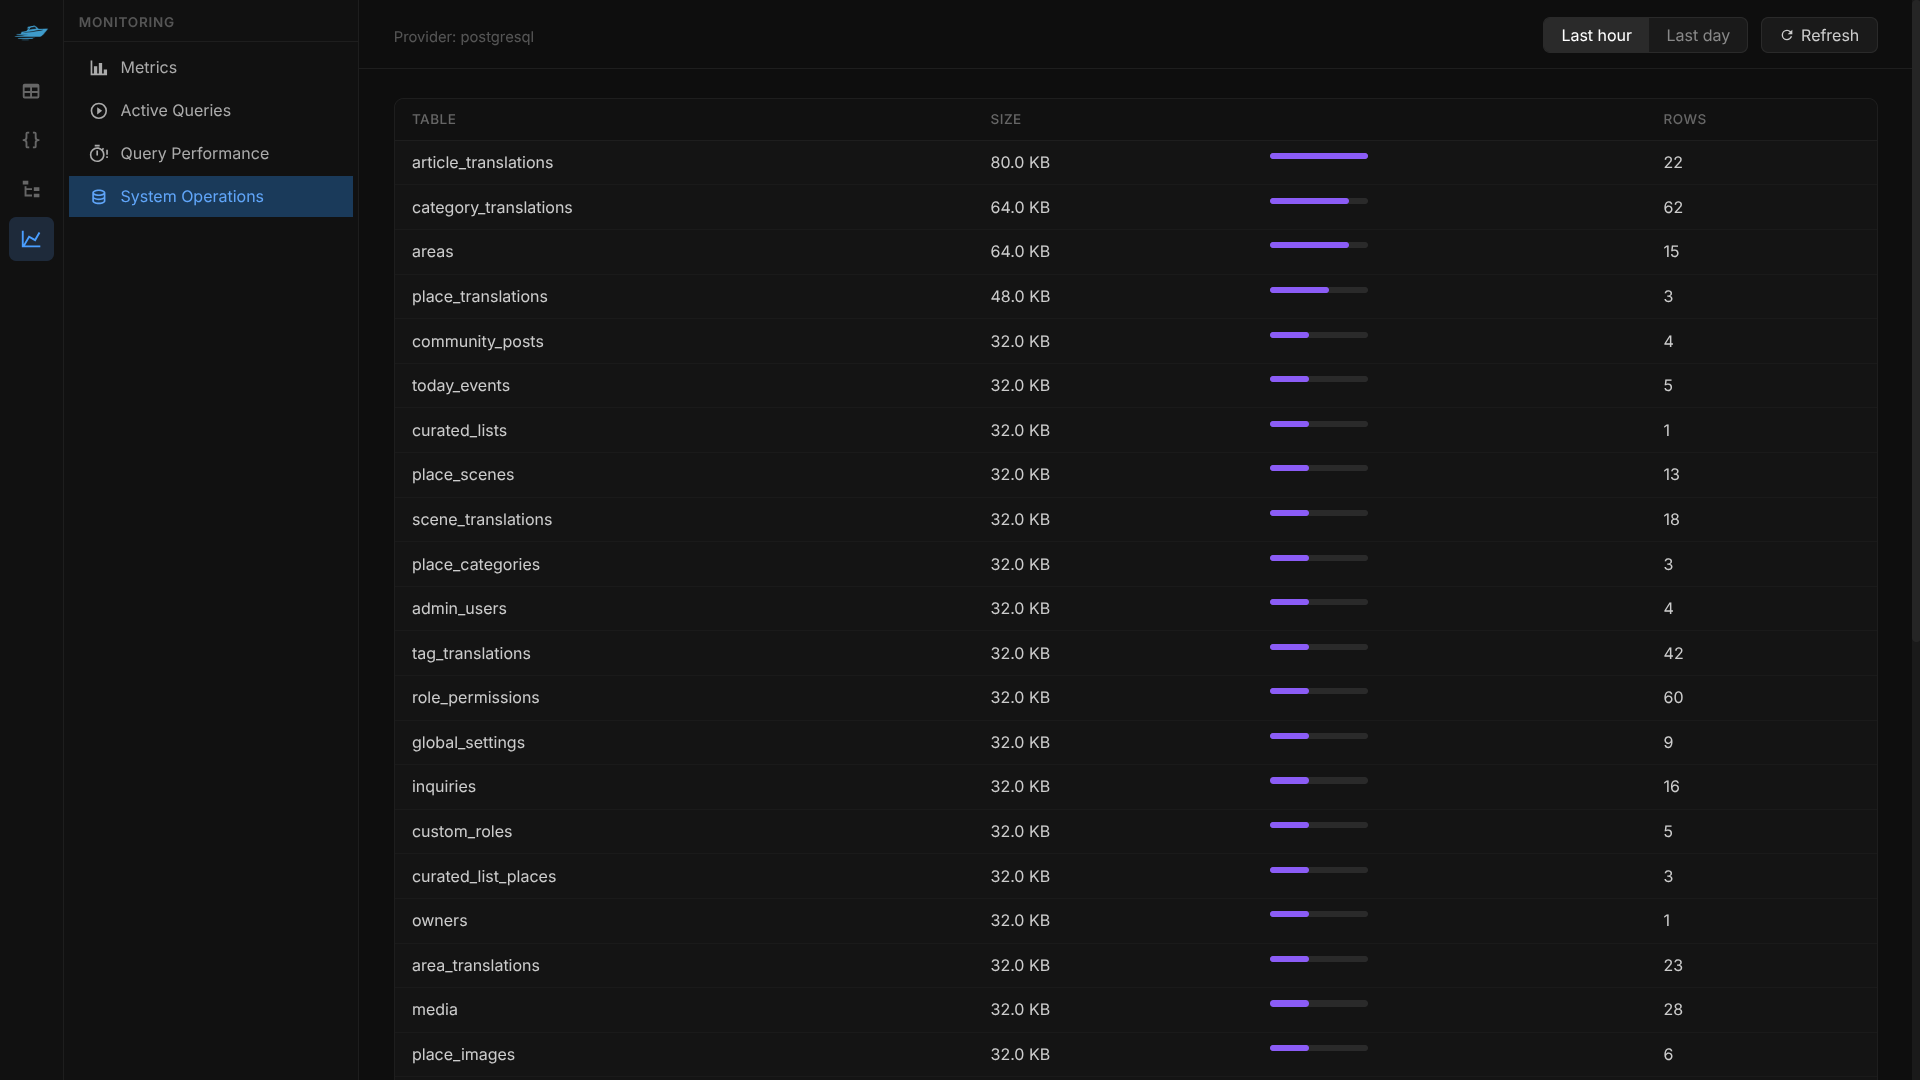
System Operations
Shows all tables with their disk size and row counts — useful for spotting which tables are growing fastest.
Time Range & Refresh
- Last hour / Last day — clears the in-browser history and starts fresh accumulation
- Refresh — forces an immediate data fetch
- Auto-refresh — runs every 30 seconds automatically
No persistent storage
Charts are built from data accumulated during your current browser session (up to 30 data points). FlashORM does not store historical metrics. For long-term monitoring, integrate with Prometheus + Grafana.